Conflict threatens innocent lives in more ways than one. While millions of people who’ve been displaced by conflict experience extreme food shortages, hunger is also being used as a deliberate tactic in conflict zones.
The UN Food and Agriculture Organization (FAO) reports that 80% of children suffering severe acute malnutrition live in countries affected by conflict.
Food security – and food insecurity – are big business.
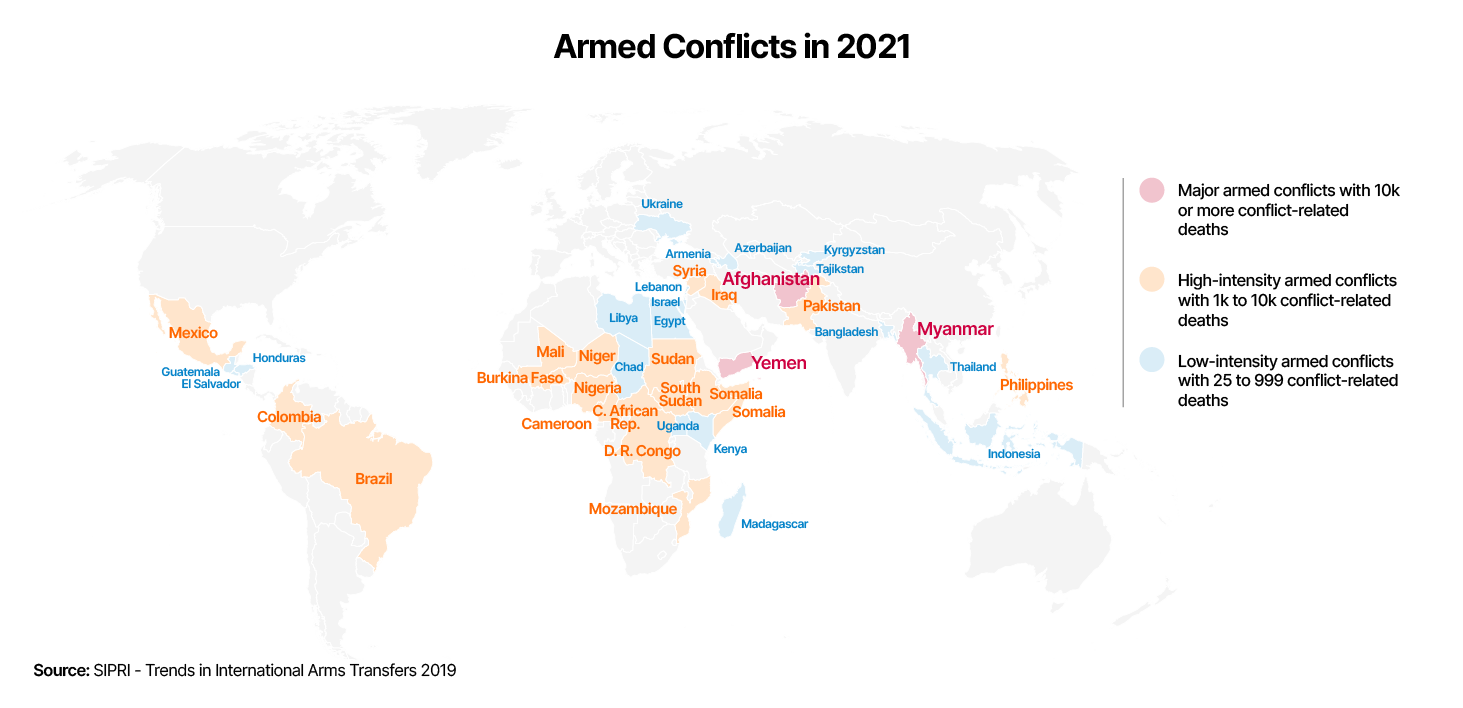
How can healthy nutritious food ever be achieved when the buying and selling of arms and weapons flourishes? In 2021, for example, 32 armed conflicts were reported in the Alert 2022! yearbook.
“Conflict is a major threat to food security and nutrition and the leading cause of global food crises. Marked increases in the number and complexity of conflicts in the last ten years have eroded gains in food security and nutrition, leading several countries to the brink of famine. Internal conflicts have surpassed the number of interstate conflicts, but with a significant rise in internationalized internal conflicts
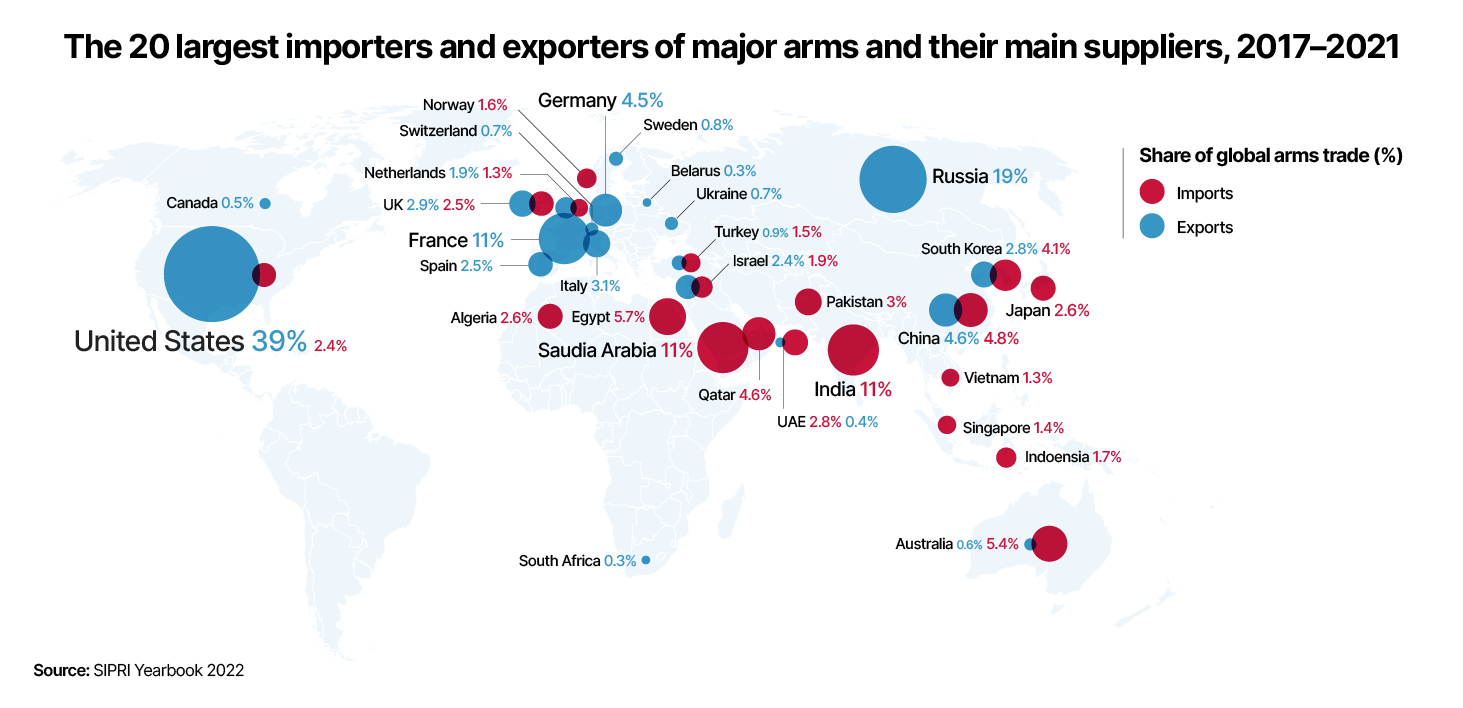
Who are the main actors selling and buying arms? How does this impact on access to and availability of food?
Those tracking world hunger issues such as researchers involved in updating the Global Hunger Index have had to address multiple ‘drivers’ that are taking place at the same time. The Global Hunger Index (GHI) is a tool designed to measure and track hunger at global, regional, and national levels. The 2022 GHI notes:
“This year’s GHI brings us face-to-face with a grim reality.”
A toxic cocktail of conflict, climate change, and the COVID-19 pandemic has already left millions exposed to food price shocks and vulnerable to further crises. Now the conflict in Ukraine — with its ripple effects on global supplies of and prices for food, fertiliser, and fuel — is turning a crisis into a catastrophe.
As we face the third global food price crisis in 15 years, it is clearer than ever that our food systems in their current form are inadequate to the task of sustainably ending poverty and hunger. This is especially true in countries that face the highest rates of undernourishment, child wasting, stunting, and child mortality due to malnutrition.”
This ‘slider map’ invites readers to explore conflict and food security in the world – who are the buyers and sellers of arms and weapons, by country? Where does armed conflict take place and how might this link to food security issues?
Explore the data used in these maps:
Suggested learning tasks
A number of learning tasks are suggested with ideas for integration as part of English, Art, Geography, Mathematics, Home Economics:
- Explore the visuals presented by scrolling between the two maps and the information they present. What do you think of the two stories that the data presents?
- Why are there different colours on the map?
- Look at the data sources and find something interesting. Draw a graph, table or pie chart of what you’ve found and prepare 1 sentence on why this is interesting to you.
- What are the differences between the maps? Prepare a short response to the two maps and what it tells us about geography and who is responsible.
- In small groups prepare a short visual presentation (using websites, statistics, images etc.) on the topic of food security – what does food security and food insecurity mean? Compare this to the food security and top 20 food companies map. How might it impact on people and places in this slider map in terms of accessing healthy nutritious food?
Explore the other two interactive maps in the series on key drivers of global hunger.
For more: