Source: www.therules.org
Worldwide:
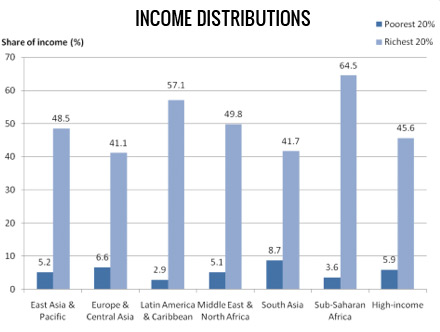
- The richest 1% of adults in the world own 40 per cent of the planet’s wealth. The ‘super-rich’ are generally those in the financial and internet service sectors
- Europe, the US and some Asia Pacific nations account for most of the extremely wealthy with more than a third living in the US, 27 per cent in Japan, 6 per cent in the UK and 5 percent in France
- Half of the world’s adult population owns less than 1 percent of the global wealth
- Some of the poorest include India with a per capita wealth of US$1,100 and Indonesia with assets per head of US$1,400
- Many African nations, North Korea and some of the poorer Asia Pacific nations is home to some of the poorest people in the world
Source: World Institute for Development Economics in 80:20 Development in an Unequal World, 6th Ed.
In Ireland:
- 187,400 people in Ireland are long-term unemployed
- Even though the poverty line fell by over 10% from €12,064 to €10,831 the numbers in poverty increased
- Over 200,000 children in Ireland are living in poverty – up 35,000 in three years
- Almost 120,000 people with a job in Ireland are at risk of poverty
- Income inequality has increased substantially in Ireland with the income of those in the top 20 per cent being 5.5 times higher than the bottom 20 per cent
- Ireland’s income distribution has remained largely unchanged over thirty years, although inequality grew over that period
- Each of the top three deciles now receives a larger proportion of Ireland’s disposable income than they did thirty years ago, while the bottom six receive a lower proportion
- Today the top 10 per cent of the population receives almost 14 times more disposable income than the poorest 10 per cent receive (28.5% as compared to 2.06%). In 1980, it was 8 times more
- The top 10% of the population now receives more disposable income than the bottom 60% of the population
Source: www.socialjustice.ie and www.combatpoverty.ie
What is Poverty in Ireland?
The Irish Government defines poverty in relation to a lack of ‘material, cultural and social’ inadequacies as compared to the ‘norm’ for society:
“People are living in poverty if their income and resources (material, cultural and social) are so inadequate as to preclude them from having a standard of living which is regarded as acceptable by Irish society generally. As a result of inadequate income and other resources people may be excluded and marginalised from participating in activities which are considered the norm for other people in society.”
More than not having the required basic material means necessary to survive such as adequate financial resources to buy food, clothing, pay for heating, etc., poverty is also about not having the money to feel like you belong to society – not being able to engage in social activities like going to the cinema, go on a family holiday, etc.
The rate of poverty in Ireland is described as being ‘at risk of poverty’ (or relative poverty) and ‘consistent poverty,’ as measured by the Central Statistics Office:
- At Risk of Poverty: defines someone who has an income that is below 60% of the median income in Ireland, which in 2010, amounted to an income below €207.94 a week for an adult. This figure is adjusted according to household type. So for a family with 2 adults and 2 children that weekly poverty line is €482.41
- Consistent Poverty: is when an income is below 60% of the median, but enforced deprivation is also experienced –where an individual/family are on a low income but are still not able to afford basic necessities like new clothes, food such as meat or fish, unable to heat their home or pay household bills, etc.
Amount of disposable household income by decile, 2009 and 2010
| Decile | Weekly disposable income 2009 | Annual disposable income 2009 | Weekly disposable income 2010 | Annual disposable income 2010 |
| Bottom | €210.45 | €10,973 | €171.24 | €8,928 |
| 2nd | €320.37 | €16,705 | €283.39 | €14,776 |
| 3rd | €443.07 | €23,103 | €398.63 | €20,784 |
| 4th | €555.88 | €28,985 | €502.65 | €26,208 |
| 5th | €675.19 | €35,206 | €607.02 | €31,650 |
| 6th | €802.53 | €41,846 | €719.56 | €37,518 |
| 7th | €965.83 | €50,361 | €872.53 | €45,494 |
| 8th | €1,140.49 | €59,468 | €1,058.10 | €55,169 |
| 9th | €1,422.84 | €74,191 | €1,329.25 | €69,307 |
| Top | €2,276.00 | €118,677 | €2,369.53 | €123,547 |
Source: SocialJustice.ie
Why is there poverty in Ireland?
Structural factors influence poverty in Ireland. These include the uneven distribution of economic resources such as wealth; employment – being unemployed or in a low-paid job; age – if you are a pensioner or a child of parents who are poor; social resources such as health – the long-term ill or those who are disabled or access to (and affordability) proper healthcare in rural locations; education – those that left school early or without any qualifications; family structure – one parent families; living in a disadvantaged community or in an area with few employment opportunities; etc.
Global poverty (and wealth)
The WHO defines poverty as:
“Poverty is associated with the undermining of a range of key human attributes, including health. The poor are exposed to greater personal and environmental health risks, are less well nourished, have less information and are less able to access health care; they thus have a higher risk of illness and disability. Conversely, illness can reduce household savings, lower learning ability, reduce productivity, and lead to a diminished quality of life, thereby perpetuating or even increasing poverty.”
Source: www.who.int
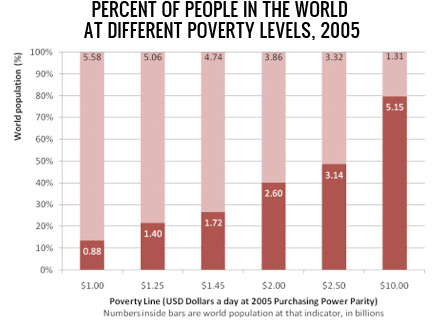
In global terms, poverty is generally defined in absolute terms of low income, which according to the World Bank is now US$1.25 a day (revised in 2008 from US$1 a day). Today, there remain 1.4 billion people who live at this poverty line or below, which is higher than at the older measure of $1 a day (2004), where there were 984 million. Rural areas account for three in every four people living on less than US$1 a day. Although, as the section on Shelter above shows, urbanization is not synonymous with human progress, and the rate of pace for urban slum growth is dramatically passing by any urban growth.
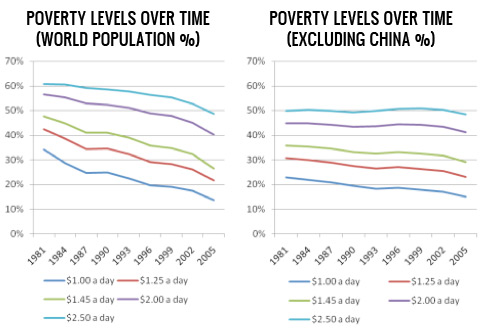
The World Bank states that “the incidence of poverty in the world is higher than past estimates have suggested” mainly because previous data “had implicitly underestimated the cost of living in most developing countries.” Also, this scenario does not capture the ‘global food crisis’ or the spiraling costs of energy, which estimates show could plunge another 100 million people into poverty. However, overall, the rate of poverty worldwide has decreased by about a quarter since 1981 (to 2005). This reality however is heavily impacted by region. The most impressive progress has been seen in China, where poverty rates fell from 85% to 15.9%, (over 600 million people) and accounts for nearly all of the world’s reduction in poverty. Without China’s statistics of progress, poverty globally fell by around 10%.


Source: World Bank Development Indicators, 2008
At the World Bank poverty line of US$2.50 per day, there are some 3 billion people – that’s nearly half the world population. The next poverty line indicator is set at US$10 a day, which is experienced by at least 80% of humanity.
Multidimensional Poverty Index
A new poverty measure was launched in July 2010 by the Oxford Poverty and Human Development Initiative (OPHI) of Oxford University and the Human Development Report Office of the United Nations Development Programme (UNDP). This measure seeks to provide a new “multidimensional” view of poverty. Known as the ‘Multi-dimensional Poverty Index’ – the MPI, it now replaces the Human Poverty Index in use since 1997. The MPI was first published in the 2010 Human Development Report. It identifies deprivations across the same three dimensions as the HDI – life expectancy, educational attainment and income – and shows the number of people who are poor (suffering a given number of deprivations) and the number of deprivations that poor households typically experience. According to the MPI from the 2010 Human Development Report, there are some 1.75 billion people in the 104 countries covered by the MPI—a third of their population — who live in multidimensional poverty. This means that at least 30 percent of the indicators reflect acute deprivation in health, education and standard of living. This is greater than the estimated 1.44 billion people in those countries who live on the World Bank estimates of US$1.25 a day or less.
Wealth Facts
- The poorest 10% of the population accounted for just 0.5% of wealth, whereas the wealthiest 10% accounted for 59% of all the consumption.
- The GDP (Gross Domestic Product) of the 41 Heavily Indebted Poor Countries (567 million people) is less than the wealth of the world’s 7 richest people combined
- World GDP in 2011 was US$69.97 trillion:
- The world’s wealthiest countries (with approximately 1 billion people) accounted for US$36.6 trillion dollars (76%)
- The world’s billionaires — that’s 497 people (approximately 0.000008% of the world’s population) — were worth US$3.5 trillion (over 7% of world GDP)
- Low income countries accounted for just US$1.6 trillion of GDP (3.3%)
- Middle income countries made up the rest of GDP at just over US$10 trillion (20.7%)
- An analysis of long-term trends shows the distance between the richest and poorest countries is increasing dramatically:
- 3 to 1 in 1820
- 11 to 1 in 1913
- 35 to 1 in 1950
- 44 to 1 in 1973
- 72 to 1 in 1992
Child poverty:
- Of the 2.2 billion children in the world, 1 billion live in poverty, where 22,000 die each day due to poverty
- 1.9 billion children live in the developing world. Of these there are:
- 640 million are without adequate shelter
- 400 million have no access to safe water
- 270 million have no access to health services
- 121 million are out of education worldwide
- 10.6 million died in 2003 before they reached the age of 5 years
- 1.4 million die each year from lack of access to safe drinking water and adequate sanitation
- 2.2 million die each year because they are not immunized
- 15 million are orphaned due to HIV and AIDS
- Nearly 28 per cent are estimated to be underweight or stunted – the majority of these are in South Asia and sub-Saharan Africa
- 72 million of primary school age is not in school – 57 per cent of these are girls
Less than 1% of what the world spent every year on weapons was needed to put every child into school by the year 2000 and yet it didn’t happen.
