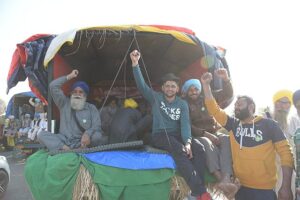
3 countries who used COVID-19 restrictions as a weapon against social justice
Kai Evans explores how governments used COVID-19 restrictions for the wrong reasons.
Kai Evans explores how governments used COVID-19 restrictions for the wrong reasons.
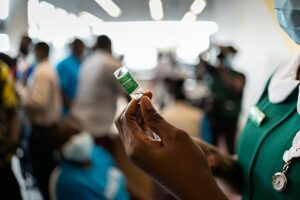
COVID-19 vaccine inequality remains, despite many of us returning to a form of ‘normality.’ Kai Evans finds out why.
Kai Evans reviews lessons learned from the pandemic about protecting civil society space during a crisis.