We’ve never known more about the way our world works, and our connections to it, than we do today. The information available about our use of food and how our food systems operate can, at times, seem overwhelming.
Here are four facts and graphics to get you started, based on official (and verified sources). There are many others – feel free to tag us on social media with your favourites on World Food Day (and beyond!).
- Tag us on Facebook @DevEdIreland and and Twitter @DevEdIreland #WorldFoodDay with your favourite charts, graphics or infographics

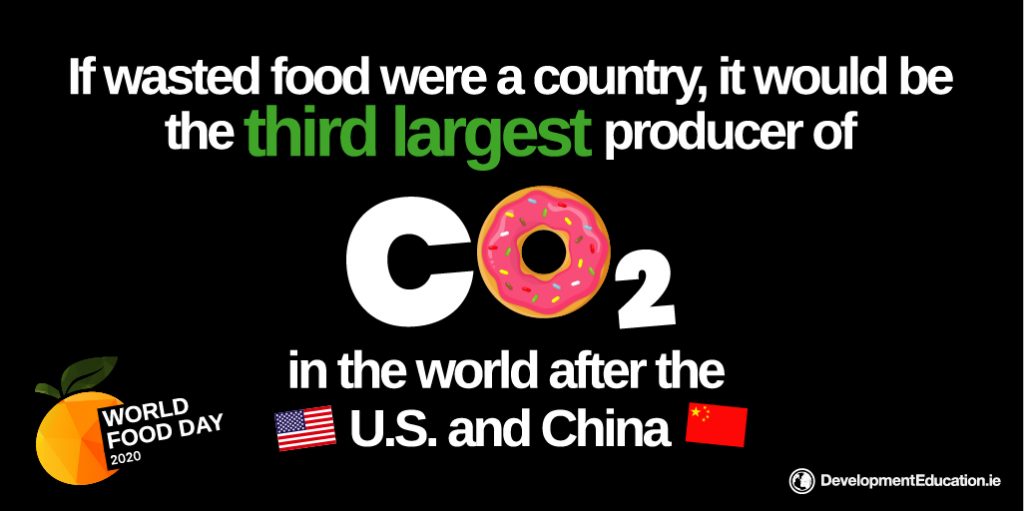
1. The geography of industrial pollution emissions

- Data reference: UN Environmental Programme
- Download graphic: geography of industrial pollution emissions
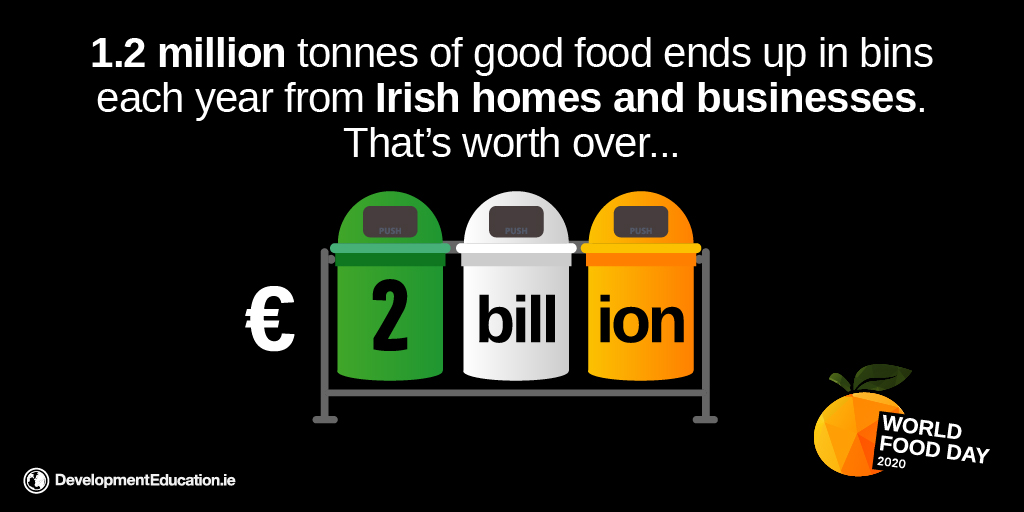
2. The scale of food waste in Ireland

- Data references: stopfoodwaste.ie & Environmental Protection Agency
- Download the graphic: the scale of food waste in Ireland
3. The cost of food waste on a global scale

- Data reference: CNN & Worldvision
- Download the graphic: the cost of food waste on a global scale
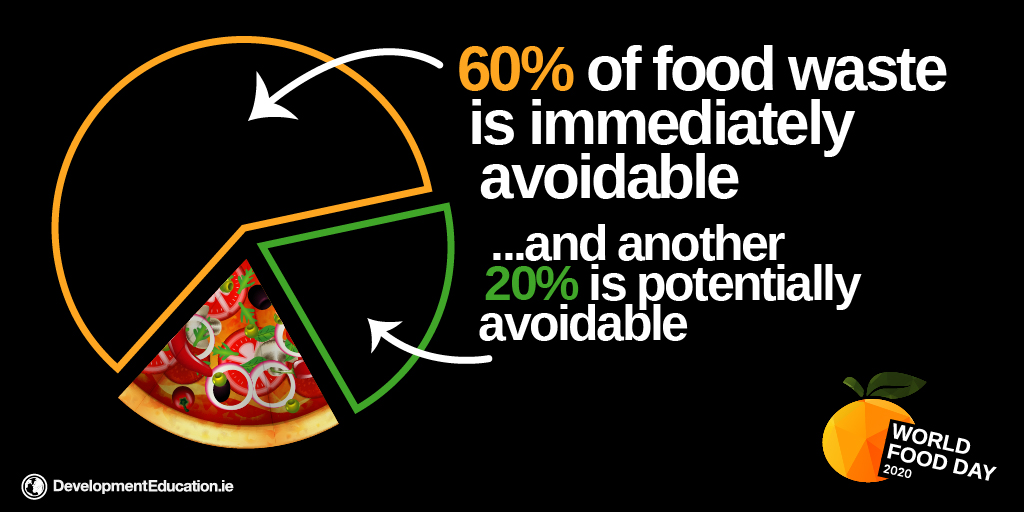
4. How much food waste is avoidable

- Data reference: Department of Communications, Climate Action & Environment
- Download the graphic: How much food waste is avoidable
//
World Food Day 2020 materials and coverage – a series in partnership with Scoilnet, Concern Worldwide, Self Help Africa and developmenteducation.ie
For more, check out:
- the Great World Food Day Quiz 2020
- teaching materials
- 5 takeaways from 2 key global reports on hunger and food
- The World Food Day collection on Scoilnet with updated lesson plans
- Levelling the Field online exhibition with women farmers across Africa, by Self Help Africa
