Are countries that are home to the 20 most profitable food companies in the world at risk of becoming food insecure? Could this ever be possible?
Consider the following two quotes, one taken from American business magazine Forbes and the other from Welthungerhilfe, one of the largest private aid organisations in Germany with a focus on ending hunger by 2030 and co-publisher of the Global Hunger Index:
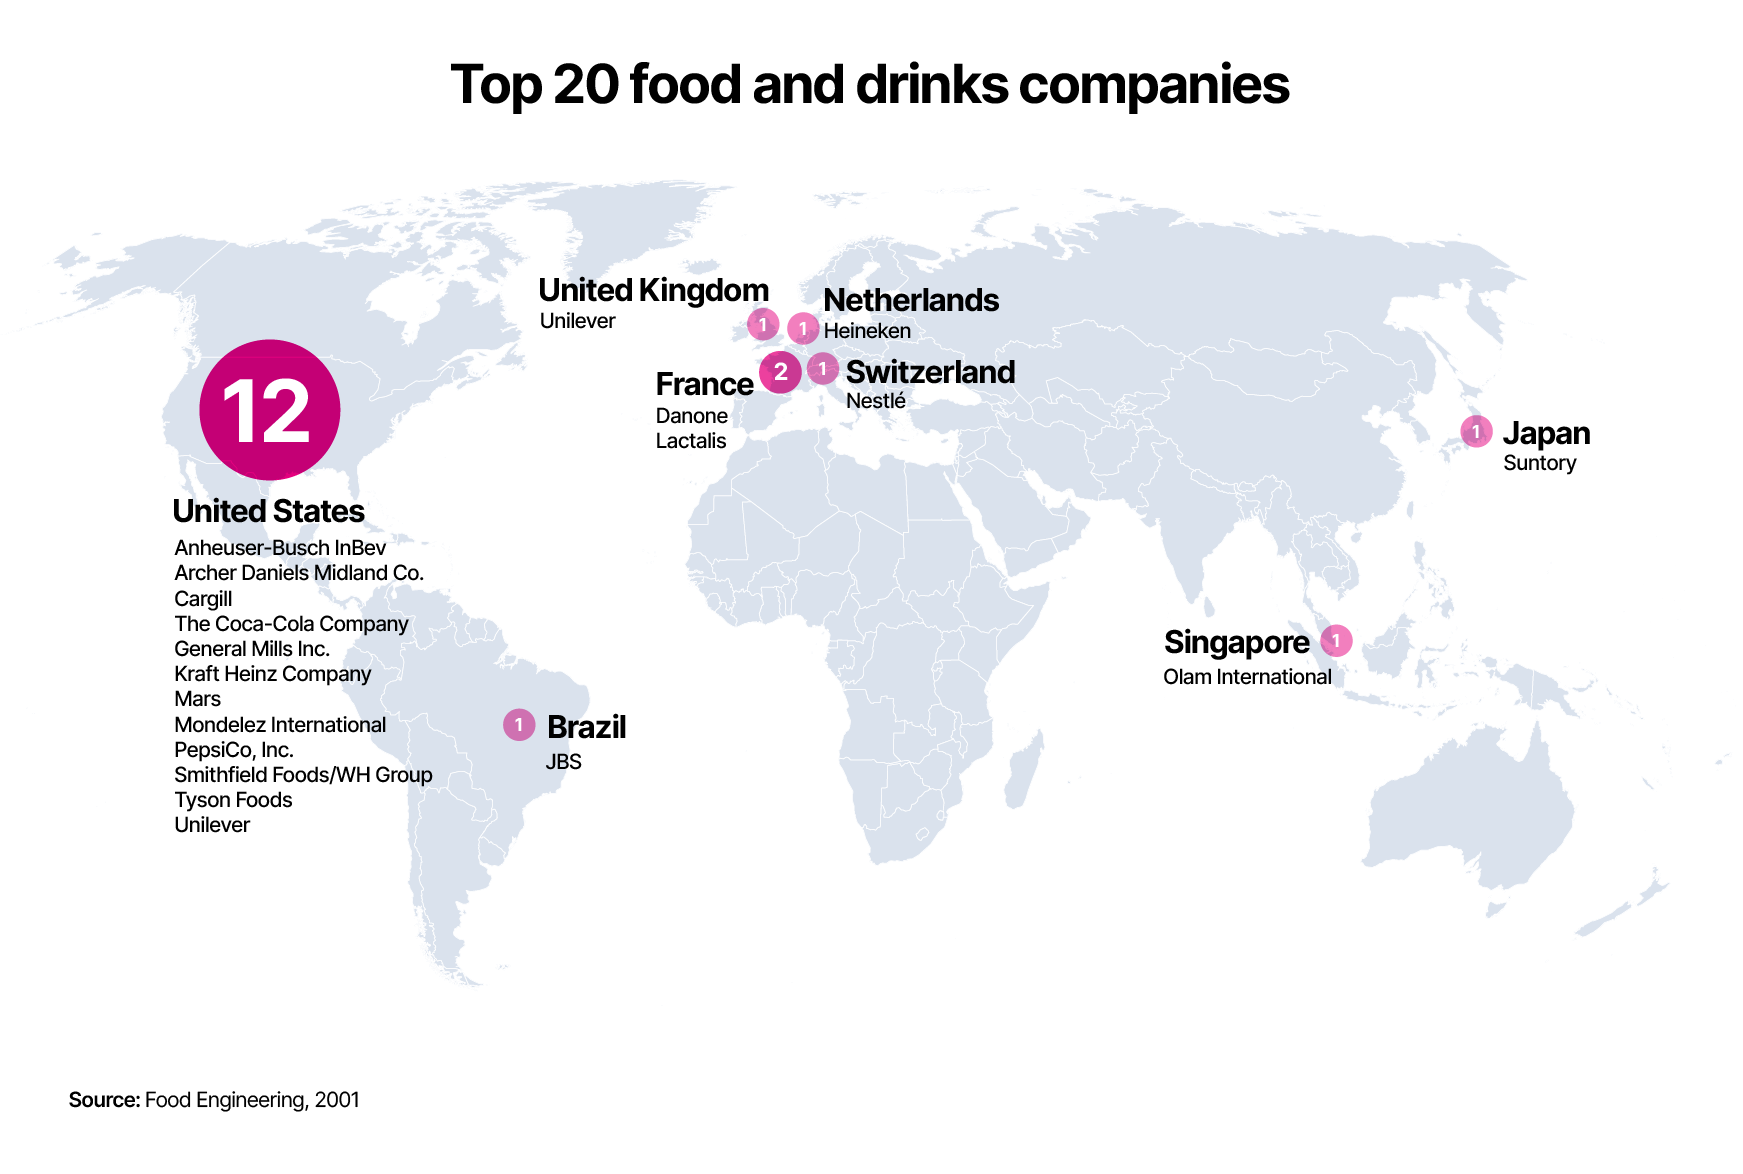
“The top 25 companies in the food and beverages sector generated $1.5 trillion in revenue in the past year, while profits for the sector increased to more than $155 billion.” – Forbes, Global 2000 list, 2022
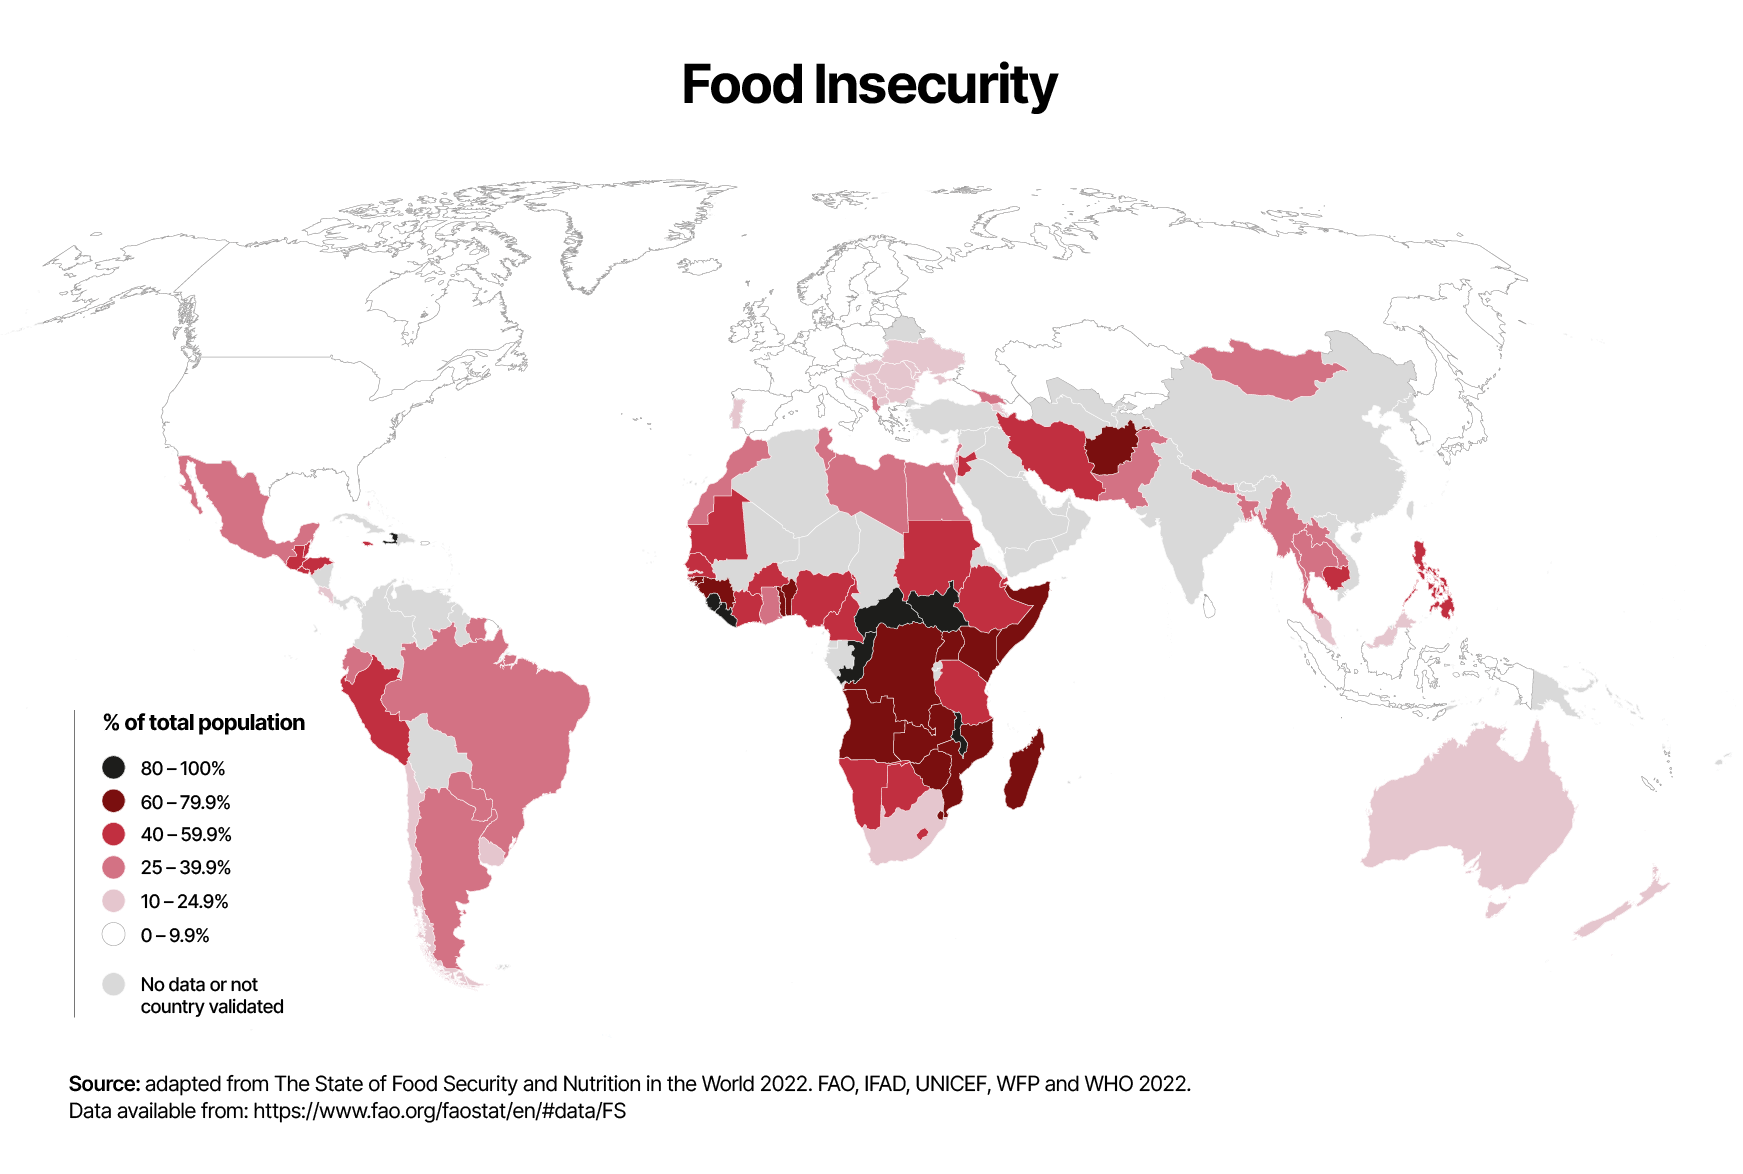
“Food is becoming more and more expensive around the world. Already in 2021, food prices worldwide rose by 28 percent in some cases, the highest increase in ten years.” – Welthungerhilfe, 2022
This ‘slider map’ invites readers to explore relationships in our food system and what can drive or deny access to healthy nutritious food based on the activities, roles and impact of countries in the world today.
The How are food security and company profits connected? interactive map explores potential connections between those who benefit from their current position in the international food and drinks industry when compared with places and regions that struggle to access nutritious and affordable food.
Key terms:
Food security exists when all people, at all times, have physical, social and economic access to sufficient, safe and nutritious food which meets their dietary needs and food preferences for an active and healthy life. Household food security is the application of this concept to the family level, with individuals within households as the focus of concern.
Food insecurity exists when people do not have adequate physical, social or economic access to food as defined above.
*key terms source: the Food and Agriculture Organisation of the UN in chapter 2 Food Security of Trade Reforms and Food Security (2003). For an introduction to the basic concepts of food security see this downloadable 3-page guide by the FAO
Explore the data used in the maps
Suggested learning tasks
A number of learning tasks are suggested with ideas for integration as part of English, Art, Geography, Mathematics, Home Economics:
- Explore the visuals presented by scrolling between the two maps and the information they present. What do you think of the two stories that the data presents?
- Why are there different colours on the map?
- What does the geography of companies and their concentration on the map tell us?
- Do you recognise any of the companies in the top 20? Write a review of their performance and grade it based on ‘access to food’, ‘affordability of food’, impact on communities’ and ‘impact on the environment’.
- Look at the data sources and find something interesting. Draw a graph, table or pie chart of what you’ve found and prepare 1 sentence on why this is interesting to you.
- What are the differences between the maps? Prepare a short response to the two maps and what it tells us about geography and who is responsible.
- What factors might improve the position of the top 20 food companies yet make access to food and affordability of food less secure? What is the impact of a large food company in a country or region? Use websites and research reports to investigate. Suggested sites: The farming & environment section of The Guardian The Make it Your Business report (2021) by the Irish Consortium for Business and Human Rights and the Behind The Brands campaign by Oxfam (from 2013 but a lot of relevant and useful guides and plain-English information.
- In small groups prepare a short visual presentation (using websites, statistics, images etc.) on the topic of inequality – what does inequality mean? How might it impact on people and places in this slider map in terms of accessing healthy nutritious food, and how this might be controlled?
Explore other maps in the series on key drivers of hunger: published tomorrow.
For more:
- An additional 345 million people are food insecure. How did this happen? Is access to food or lack of food the key issue? Navika Mehta reviews the latest flagship report on global food security.